Statistics questions | form three Basic Mathematics
Find Statistics examination questions, form three Basic Mathematics in acaproso.com
| # | Question | ||||||||||||||||||||
|---|---|---|---|---|---|---|---|---|---|---|---|---|---|---|---|---|---|---|---|---|---|
| 1 | A survey of 50 families whowed the number of children per family as follows:
Mathematical Calculation |
||||||||||||||||||||
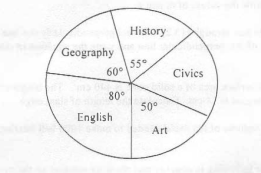
| 2 | The pie-chart below shows the number of students in one examination centre in different subjects sat for the national examinations.
Given that 220 candidates did History ; find :
Mathematical Calculation |
||||||||||||||||||||
| 3 | The data below shows test scores of a certain class in mathematics: 21 21 21 22 22 22 22 23 23 24 24 24 21 24 24 25 26 27 27 27. Construct a frequency distribution table showing scores x and frequency f. Mathematical Calculation |
||||||||||||||||||||
| 4 | The table below shows the distribution of 100 shops and their profit per shop in a certain month.
Mathematical Calculation |
||||||||||||||||||||
| 5 | A random sample of 100 students was chosen from a school. Each student`s blood pressure was measured to the nearest millimetres of mercury as shown in the table below:
Mathematical Calculation |
||||||||||||||||||||
| 6 | The following table represents age distribution of members of a school choir.
Mathematical Calculation |
||||||||||||||||||||
| 7 | The table below shows the masses of 100 students to the nearest kilogram.
Mathematical Calculation |
||||||||||||||||||||
| 8 | Carefully study the frequency distribution table for the scores of 68 students (in percentage) given here under.
Mathematical Calculation |
||||||||||||||||||||
| 9 | The heights in centimetres of 100 students of a certain school were recorded as follows:
From the above information answer the following questions.
Mathematical Calculation |
||||||||||||||||||||
| 10 | The mean of n numbers is 20. If the same numbers together with 30 give a new mean of 22, find n. Mathematical Calculation |
 Acaproso Login