Application of statistics in geography questions | form five Geography
Find Application of statistics in geography examination questions, form five Geography in acaproso.com
| # | Question | ||||||||||||||||||||||||||||||||||||||||||||||||||||||||||||||||||||||||
|---|---|---|---|---|---|---|---|---|---|---|---|---|---|---|---|---|---|---|---|---|---|---|---|---|---|---|---|---|---|---|---|---|---|---|---|---|---|---|---|---|---|---|---|---|---|---|---|---|---|---|---|---|---|---|---|---|---|---|---|---|---|---|---|---|---|---|---|---|---|---|---|---|---|
| 1 | The data below show production of Cash crops in metric tones (Hypothetical data)
Mathematical Calculation |
||||||||||||||||||||||||||||||||||||||||||||||||||||||||||||||||||||||||
| 2 | Study the data given below: Climatic data for station X
Mathematical Calculation |
||||||||||||||||||||||||||||||||||||||||||||||||||||||||||||||||||||||||
| 3 | Carefully study the following data in table below and answer the questions which follow. PRODUCTION OF MAJOR EXPORT CROPS (in tons) in 1975.
Mathematical Calculation |
||||||||||||||||||||||||||||||||||||||||||||||||||||||||||||||||||||||||
| 4 | Study the following data for 1992 census carefully.
Mathematical Calculation |
||||||||||||||||||||||||||||||||||||||||||||||||||||||||||||||||||||||||
| 5 | Study carefully the following hypothetical data of marks obtained by students in a certain class and then answer the questions that follow:
Find the folllowing
Mathematical Calculation |
||||||||||||||||||||||||||||||||||||||||||||||||||||||||||||||||||||||||
| 6 | Summarize the significance of studying statistics in Geography. Short answers |
||||||||||||||||||||||||||||||||||||||||||||||||||||||||||||||||||||||||
| 7 | Describe the types and characteristics of measures of central tendency. Long answers |
||||||||||||||||||||||||||||||||||||||||||||||||||||||||||||||||||||||||
| 8 | (a) Differentiate the following statistical concepts: (i) Inferential statistics and Descriptive statistics. (b) The form five students’ scores in Geography subject at Nganza S.S were as follows:
(i) Calculate the standard deviation. Mathematical Calculation |
||||||||||||||||||||||||||||||||||||||||||||||||||||||||||||||||||||||||
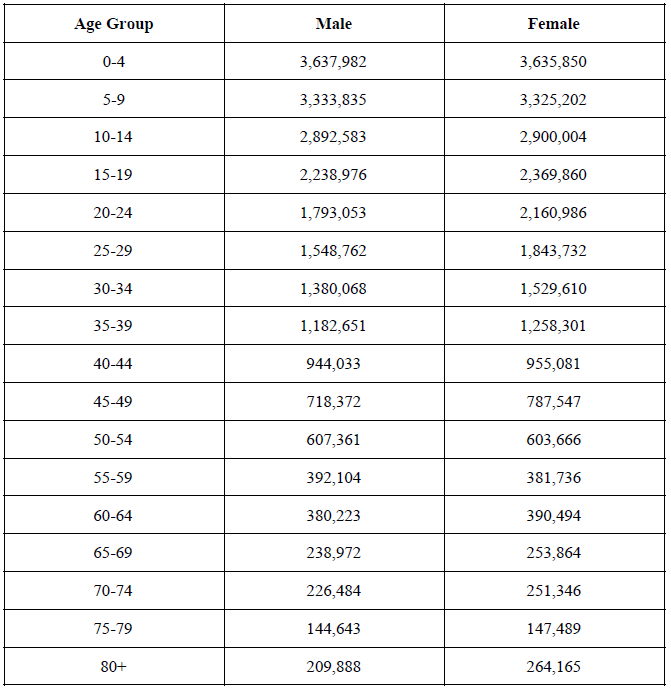
| 9 | The following table shows population distribution of Tanzania’s 2012 Population Census in five year age groups.
(a) Prepare a bar graph to show the age and sex structure of the population by percentages. Practical |
||||||||||||||||||||||||||||||||||||||||||||||||||||||||||||||||||||||||
| 10 | Study carefully the data in the following table which shows the quantity (in thousands tones) of pyrethrum produced in Kenya from 1980 to 1989 and then answer the questions that follow:
(a) Present the data using divergent line graph. Mathematical Calculation |
||||||||||||||||||||||||||||||||||||||||||||||||||||||||||||||||||||||||
 Acaproso Login