Application of statistics questions | form three Geography
Find Application of statistics examination questions, form three Geography in acaproso.com
| # | Question | |||||||||||||||||||||||||||||||||||||||
|---|---|---|---|---|---|---|---|---|---|---|---|---|---|---|---|---|---|---|---|---|---|---|---|---|---|---|---|---|---|---|---|---|---|---|---|---|---|---|---|---|
| 1 | State the differences between the following types of data: Short answers |
|||||||||||||||||||||||||||||||||||||||
| 2 | Read carefully the hypothetical data presented below and then answer the questions that follow. Cash crops production in Tanzania in ‘000 tonnes.
(a) Represent data bove using a compound bar graph. Short answers |
|||||||||||||||||||||||||||||||||||||||
| 3 | Read carefully the climatic data for station A presented in the Table and answer the questions that follow:
(i) Describe the climatic conditions of station A. Short answers |
|||||||||||||||||||||||||||||||||||||||
| 4 | Data in the following table show the enrolment of Form One students at Mji Mpya Secondary School from 2006 to 2010. Carefully study them and answer the questions that follow.
(a) Present the data by using simple bar graph. Short answers |
|||||||||||||||||||||||||||||||||||||||
| 5 | Carefully study the hypothetical data presented below showing the export of crops from Tanzania. The Export of Crops in Tonnes
(a) Present the data using compound bar graph. Short answers |
|||||||||||||||||||||||||||||||||||||||
| 6 | (a) Explain the meaning of the standard deviation. Mathematical Calculation |
|||||||||||||||||||||||||||||||||||||||
| 7 | The table below shows agricultural production in Tanzania from 2000 to 2006 in `000 tonnes.
(a) Present the data by using a grouped line graph. Short answers |
|||||||||||||||||||||||||||||||||||||||
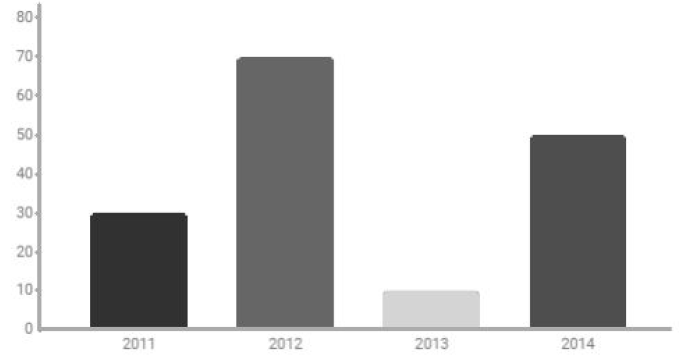
| 8 | Carefully study the following statistical graph showing coffee production (in tonnes) in Tanzania, from 2011 to 2014 and answer the questions that follows:
(a) Describe the type of statistical graph used. Short answers |
|||||||||||||||||||||||||||||||||||||||
| 9 | (a) Give three differences between interview and observation. Short answers |
|||||||||||||||||||||||||||||||||||||||
| 10 | Carefully study the weather data for a station in Australia and answer the questions that follow.
Mathematical Calculation |
|||||||||||||||||||||||||||||||||||||||
 Acaproso Login