
Statistics questions | form three Basic Mathematics
|
(6552) Question Category: Mathematical Calculation A survey of 50 families whowed the number of children per family as follows:
Answer / Solution UNSOLVED |
||||||||||||||||
|
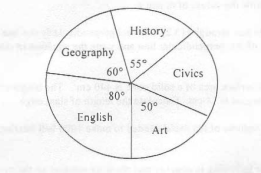
(6553) Question Category: Mathematical Calculation The pie-chart below shows the number of students in one examination centre in different subjects sat for the national examinations.
Given that 220 candidates did History ; find :
Answer / Solution UNSOLVED |
||||||||||||||||
|
|
||||||||||||||||
|
(6554) Question Category: Mathematical Calculation The data below shows test scores of a certain class in mathematics: 21 21 21 22 22 22 22 23 23 24 24 24 21 24 24 25 26 27 27 27. Construct a frequency distribution table showing scores x and frequency f. Answer / Solution UNSOLVED |
||||||||||||||||
|
(6555) Question Category: Mathematical Calculation The table below shows the distribution of 100 shops and their profit per shop in a certain month.
Answer / Solution UNSOLVED |
||||||||||||||||
|
|
||||||||||||||||
|
(6556) Question Category: Mathematical Calculation A random sample of 100 students was chosen from a school. Each student`s blood pressure was measured to the nearest millimetres of mercury as shown in the table below:
Answer / Solution UNSOLVED |
||||||||||||||||
|
View All Topics |
News & Updates | Recently
| Recent Updates |
|---|
|
|
|
|


